Web GIS & Spatial Dashboards
Develop dynamic, real-time, and interactive GIS dashboards for multiple use cases. Enhance planning and monitoring with intuitive visual tools.
Visualize Your World with Web GIS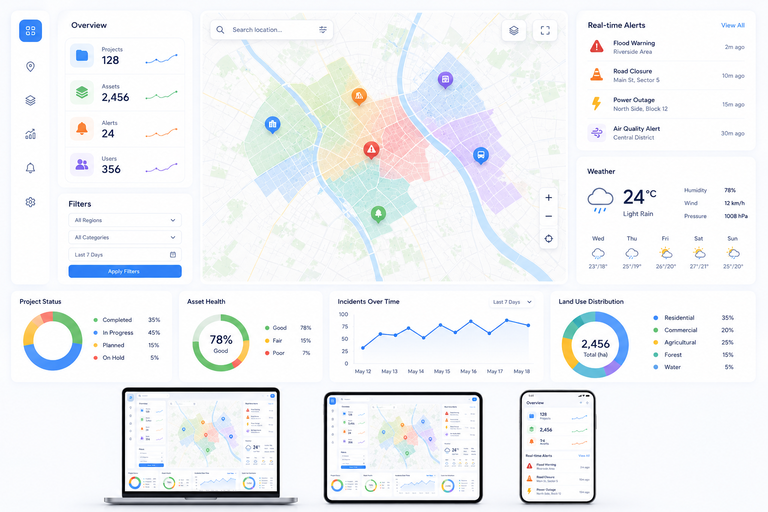
Develop dynamic, real-time, and interactive GIS dashboards for multiple use cases. Enhance planning and monitoring with intuitive visual tools.
Visualize Your World with Web GIS
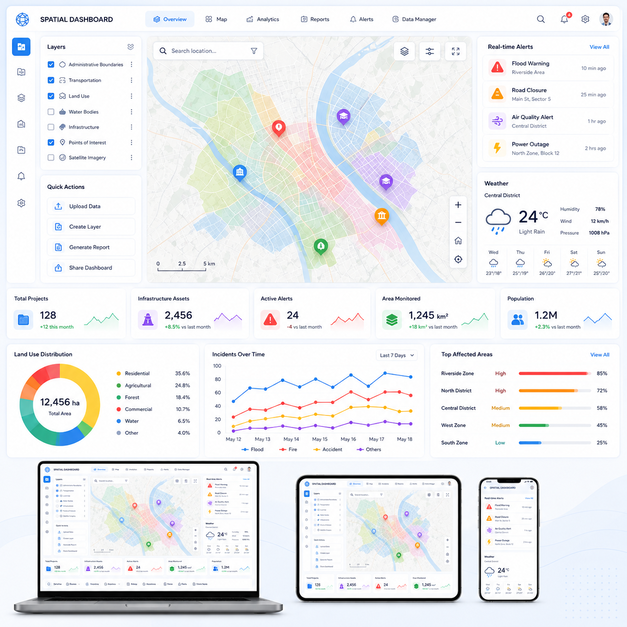
Elevate your spatial data analysis and presentation with our Web GIS & Spatial Dashboards. We develop dynamic, real-time, and highly interactive GIS dashboards tailored for a multitude of use cases. These intuitive visual tools empower enhanced planning, efficient monitoring, and more informed decision-making.
Why this service stands out
Visual, interactive data helps stakeholders make quicker, more informed choices.
Gain real-time insights into location-based operations and assets.
Collaborate more effectively on projects with shared, interactive spatial data.
Optimize deployment of resources based on dynamic geographic intelligence.
Make complex GIS data accessible and understandable to non-expert users.
Reduce manual data processing and enhance efficiency in surveillance.
What makes this service stand out
Developing web-based applications that allow users to explore, query, and interact with geospatial data intuitively.
Displaying live geospatial data streams on dashboards for immediate monitoring and situational awareness.
Designing tailored dashboards that consolidate various geographic information and present key spatial indicators visually.
Allowing users to overlay multiple data layers, enhancing contextual understanding and comparative analysis.
Enabling powerful search and filtering capabilities to quickly isolate specific spatial features or data points.
Ensuring optimal performance and accessibility of Web GIS solutions across all mobile devices and tablets.
How we deliver results
Understanding the specific spatial data, KPIs, and visualization needs for your dashboard.
Connecting diverse geospatial data sources and preparing them for dashboard visualization.
Building interactive Web GIS dashboards with custom maps, charts, and data widgets.
Launching the dashboard and providing training to ensure effective utilization by your team.